


 EchoAPI for VS Code

 EchoAPI for IntelliJ IDEA

 EchoAPl-Interceptor

 EchoAPl CLI
 API Design
 API Debug
 API Documentation
 Mock Server


Why Is Your API Slow? A Complete Guide to Understanding Performance Bottlenecks
API speed can make or break user experience. This guide maps the 8-step request journey so you can spot and fix every millisecond lost.

APIs are the unsung heroes of modern web and mobile applications. Every time you load a webpage, submit a form, or tap a button in an app, there's a good chance an API is quietly doing the heavy lifting in the background.
While developers often focus on whether an API is functionally working (i.e., does it return the correct data?), they sometimes overlook a crucial factor: how fast that API responds. And speed matters — a sluggish API can make an otherwise great product feel broken or frustrating to use.
This guide is for you if you’re:
- A developer or tester just starting to explore performance testing
- A product manager aiming to optimize app responsiveness
- Or anyone curious about how APIs perform under the hood
We’ll break down the full API performance testing process — in simple language, with clear structure, and insights from real-world experience.
Understanding the API Request Lifecycle
Think of an API request as a mini road trip. When a client (like a browser or mobile app) sends a request to a server, it goes through several stages — kind of like leaving home, getting directions, arriving, and having a conversation.
Here’s the full journey:
- Prepare (Packing your bag)
- Socket Initialization (Finding a car)
- DNS Lookup (Checking the map)
- TCP Handshake (Calling ahead)
- SSL/TLS Handshake (Confirming identity)
- TTFB (Time to First Byte) (Saying “Hello”)
- Download (Hearing the full story)
- Process (Understanding the message)
What does each stage do?
Let’s break it down in plain terms:
- Prepare: Before sending a request, the client sets headers, checks caches, and performs security checks. A well-prepared request can avoid unnecessary delays.
- Socket Initialization: The system finds an available port to send the request. Creating a new connection every time is inefficient, especially under heavy load.
- DNS Lookup: Converts a domain like
api.example.cominto an IP address. Poor DNS performance slows down everything. - TCP Handshake: Establishes a reliable connection through a three-step handshake — like saying, “Can you hear me?” “Yes, I can.” “Let’s talk.”
- SSL/TLS Handshake: Sets up an encrypted connection for HTTPS traffic. This ensures security, but it takes time.
- TTFB (Time to First Byte): Measures how long the server takes to respond to the initial request. A high TTFB usually means backend delays.
- Download: How long it takes to receive the full response. File size, compression, and network quality all matter here.
- Process: Once received, the client parses and renders the data. Slow parsing or heavy frontend work can make pages feel unresponsive.
Common Bottlenecks and How to Fix Them
Each step in the lifecycle can become a performance bottleneck. Here's what to watch for — and how to address it.
1. Prepare
Problems:
- Requests don’t use cache
- Redundant headers or payloads
Fixes:
- Enable caching where appropriate
- Preload common resources
- Use HTTP/2 for better concurrency
2. Socket Initialization
Problems:
- Frequent reconnections
- Resource exhaustion under load
Fixes:
- Reuse sockets with Keep-Alive
- Use HTTP/2 or HTTP/3 for multiplexing
- Connection pooling for backend services
3. DNS Lookup
Problems:
- Slow DNS resolution
- Misconfigured or overloaded DNS servers
Fixes:
- Use DNS prefetching
- Configure fast public DNS (like Cloudflare or Google)
- Leverage CDN services with smart DNS routing
4. TCP Handshake
Problems:
- Latency due to poor network quality
- High round-trip times
Fixes:
- Reduce reliance on new connections
- Switch to HTTP/3 (QUIC), which eliminates handshake delay
5. SSL/TLS Handshake
Problems:
- Slow encryption setup
- Outdated TLS versions
Fixes:
- Use TLS 1.3 for faster handshakes
- Enable session resumption
- Optimize certificate chain and key size
6. TTFB (Time to First Byte)
Problems:
- Backend processing delays
- Slow database queries
- Inefficient logic
Fixes:
- Profile and optimize backend code
- Add caching layers (e.g., Redis, Varnish)
- Tune database indexes and queries
7. Download
Problems:
- Large or bloated response payloads
- Uncompressed responses
- Poor network conditions
Fixes:
- Enable Gzip or Brotli compression
- Paginate large datasets
- Use a CDN to deliver responses closer to the user
8. Process
Problems:
- Heavy parsing or rendering on client-side
- Complex DOM structures
- Blocking JavaScript
Fixes:
- Simplify and flatten JSON structures
- Minimize DOM nodes
- Defer or lazy-load non-critical JS
Why This 8-Step Breakdown Matters
Understanding each stage of an API request allows you to:
Pinpoint Issues Faster
Instead of vague performance problems, you’ll know: Is DNS the culprit? Is it a backend delay?
Collaborate Across Teams
Clear visibility into performance phases makes cross-functional debugging easier. Frontend, backend, ops — everyone speaks the same language.
Automate Monitoring
Set up tools to monitor each phase. You’ll detect regressions and anomalies before users do.
Optimize With Real Data
No more guesswork. Let data tell you where to focus your performance efforts.
Ship With Confidence
Before every release, generate a performance report and ensure nothing has regressed.
Using EchoAPI for Real-World Testing
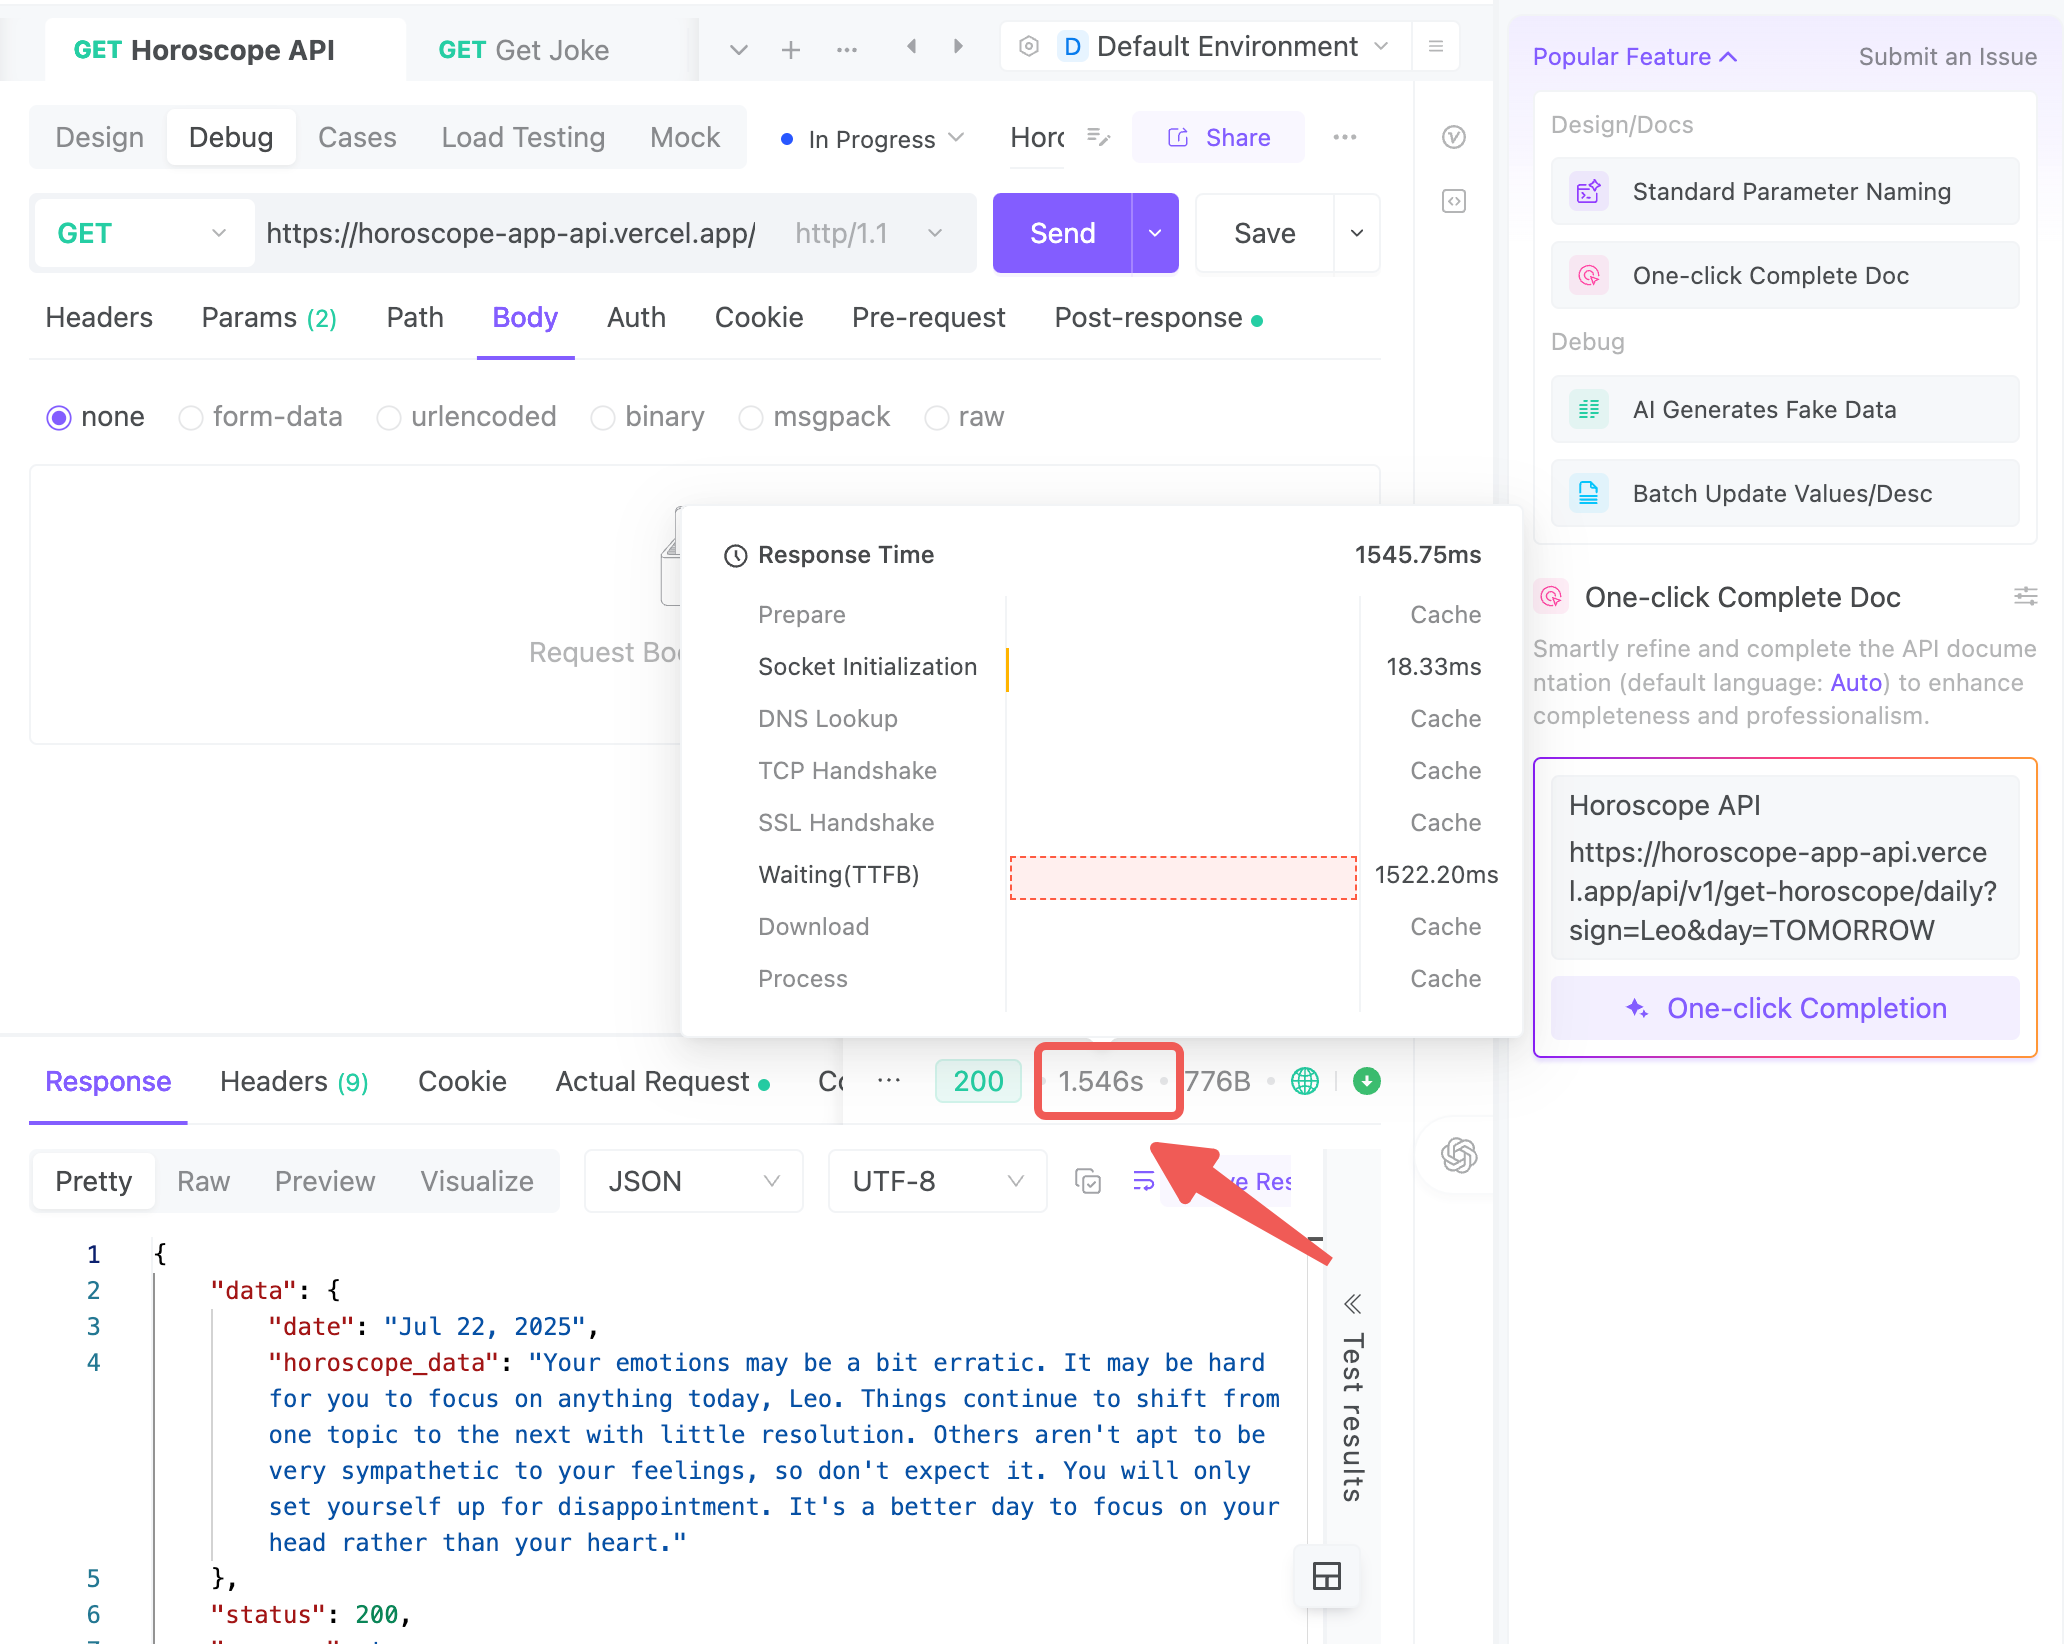
In practice, tools like EchoAPI can automate much of this process. EchoAPI breaks down every API call into its component timings — DNS lookup, TCP and TLS handshakes, TTFB, download time, and more — giving you full visibility into your API’s performance profile.
Here’s what it enables you to do:
Monitor API Behavior in Real Time
- Compare environments: dev, staging, production
- Spot differences across regions or ISPs
Quickly Identify Bottlenecks
- Know exactly where slowdowns occur — DNS, handshake, backend
- Speed up debugging and reduce test cycles
Generate Visual Performance Reports
- Use as evidence in sprint reviews, postmortems, or QA sign-offs
- Establish baselines and set alert thresholds
Run Batch Tests on Multiple APIs
- Validate performance consistency across key endpoints (login, search, upload, etc.)
- Prioritize which endpoints need optimization
Integrate With CI/CD Pipelines
- Run performance regressions automatically before each release
- Catch performance drops early and avoid last-minute rollbacks
Final Thoughts
API performance isn’t just about whether your endpoints work — it’s about how fast they work under real-world conditions. By breaking the request lifecycle into 8 distinct stages, you gain clarity and control over every millisecond of the process.
Each stage comes with its own risks and optimization levers. Combine that knowledge with a monitoring tool like EchoAPI, and you have a powerful system for performance testing, debugging, and shipping reliable, fast APIs.
For developers, QA engineers, and product teams alike — mastering this workflow can dramatically improve user experience, system efficiency, and team velocity.
Let performance be your API’s superpower — not its bottleneck.
