Understanding Key API Request Metrics: A Complete Guide to Performance Insights
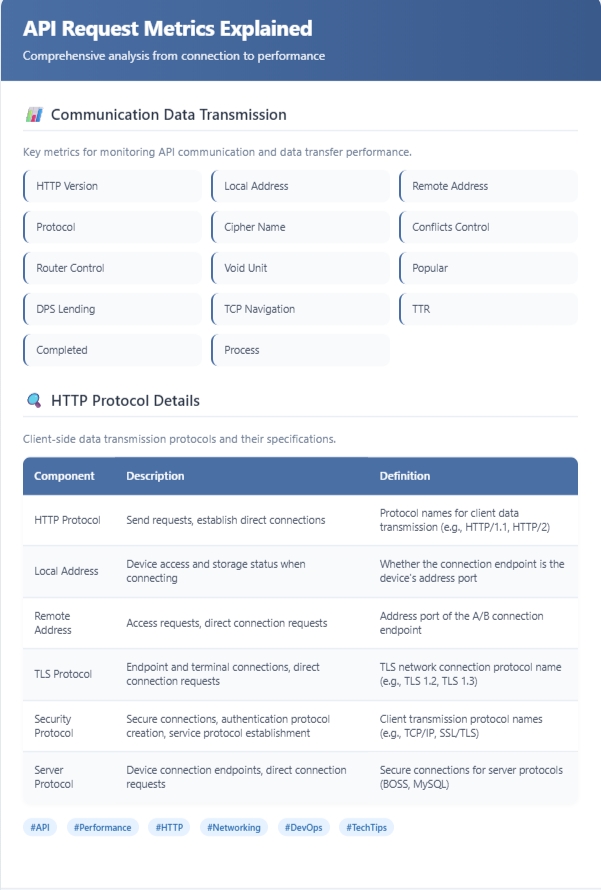
API performance metrics are crucial for optimizing efficiency and security in your API requests. This guide explores key indicators like HTTP version, TLS protocol, and response time, providing actionable insights to enhance your API's performance.
In everyday API development, testing, and operations, engineers constantly deal with performance metrics. Whether you’re an API tester, backend developer, or full-stack engineer, you likely pay close attention to straightforward indicators such as response body, headers, duration, and data size when debugging with tools like EchoAPI.
However, beyond these visible details lies another layer of hidden yet critical metrics that often go unnoticed — and they can be the key to identifying performance bottlenecks and uncovering potential security issues.

This article explores these “hidden indicators” from three dimensions — communication fundamentals, security mechanisms, and performance metrics — to help you fully understand how they impact API performance.
Communication Fundamentals: The “Identity” of an API Request
Just as a delivery requires a sender, recipient, and route, API requests also rely on a set of basic identifiers to ensure reliable transmission. These foundational metrics describe where your data comes from and where it’s going.
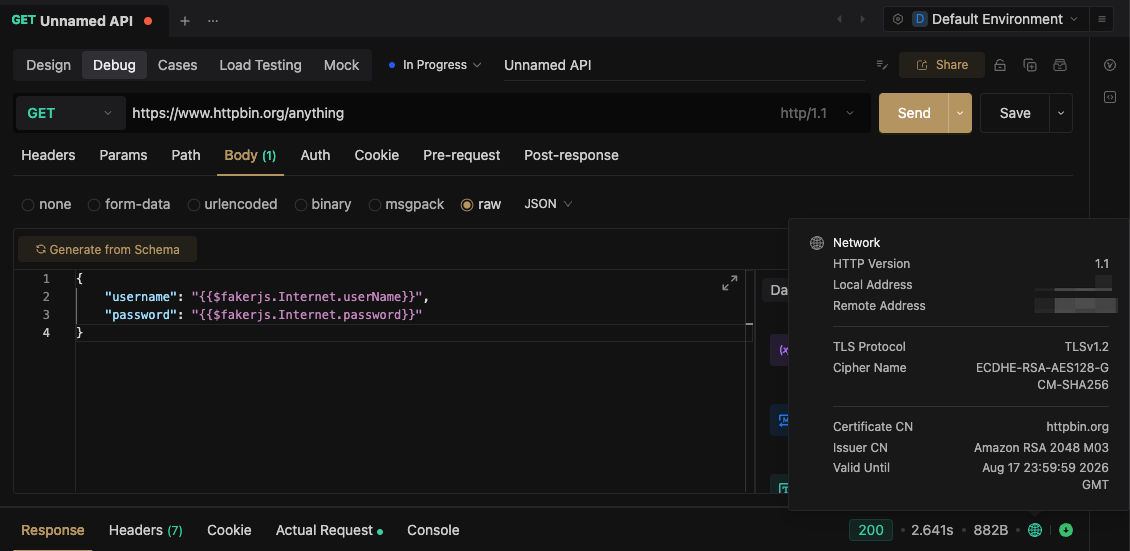
EchoAPI Network Metrics

1. HTTP Version — The “Language” of Communication
- Definition: The version of the HTTP protocol used between client and server (e.g., HTTP/1.0, HTTP/1.1, HTTP/2).
- Why it matters: Determines the efficiency of data transmission.
- HTTP/1.0 uses short-lived connections, reestablishing a connection for every request.
- HTTP/1.1 introduces persistent connections (keep-alive).
- HTTP/2 allows multiplexing — handling multiple requests over a single connection.
- Example: HTTP/1.0 is like hanging up after every sentence in a phone call; HTTP/1.1 keeps the line open for a full conversation.
- Insight: If an API uses HTTP/1.0 with high request volume, connection overhead can drain resources. Upgrading to HTTP/1.1 or HTTP/2 can significantly reduce load — one payment API saw a 30% drop in server utilization after doing so.
2. Local Address — The “Departure Point”
- Definition: The local device’s IP address and port initiating the request (e.g.,
192.168.1.100:54321). - Purpose: Identifies the origin of the request so responses can return correctly.
- Insight: If errors occur frequently from a specific local address, the issue may lie in that client’s network environment or configuration.
3. Remote Address — The “Destination”
- Definition: The target server’s IP address and port (e.g.,
203.0.113.5:443). - Purpose: Defines where the request is sent.
- Insight: Useful for confirming that requests are routed correctly. For instance, if a CDN is configured but the Remote Address points to the origin server, the CDN isn’t working properly.
Security Mechanisms: The “Shield” Protecting Your API Communication
When APIs handle sensitive data — like user credentials or payments — strong security protocols are non-negotiable. The following metrics reflect how securely your data travels between client and server.
1. TLS Protocol — Encryption Version
- Definition: The version of the TLS (Transport Layer Security) protocol in use, such as TLS 1.2 or 1.3.
- Why it matters: Newer versions provide stronger encryption and more efficient handshakes.
- Insight: Outdated versions (e.g., TLS 1.0) can expose vulnerabilities such as Heartbleed. Many compliance standards (like PCI DSS) now require TLS 1.2 or higher.
2. Cipher Suite — The “Encryption Toolkit”
- Definition: The negotiated encryption algorithms (e.g.,
ECDHE-RSA-AES256-GCM-SHA384). - Insight: Avoid weak ciphers like RC4. Strong suites using AES-GCM and SHA256+ ensure both confidentiality and integrity.
- Example: An e-commerce API once used RC4, which allowed data decryption. Switching to AES256-GCM fixed the issue.
3. Certificate CN — The Server’s “Legal Name”
- Definition: The Common Name on the SSL certificate (e.g.,
*.example.com). - Insight: Confirms the server’s identity. A mismatch can signal a misconfiguration or even a phishing attempt.
4. Issuer CN — The “Authority” That Issued the Certificate
- Definition: The Certificate Authority (CA) name (e.g., Let’s Encrypt, DigiCert).
- Insight: Certificates issued by untrusted authorities can cause clients to reject connections. Always ensure your CA is recognized by browsers.
5. Valid Until — Certificate Expiration Date
- Why it matters: Expired certificates can immediately break production systems.
- Best practice: Monitor expiry dates and renew certificates at least 30 days in advance to avoid outages.
Performance Metrics: The “Speed Dashboard” of API Requests
Performance is the heart of user experience. These metrics break down the complete lifecycle of an API request, from initiation to completion.
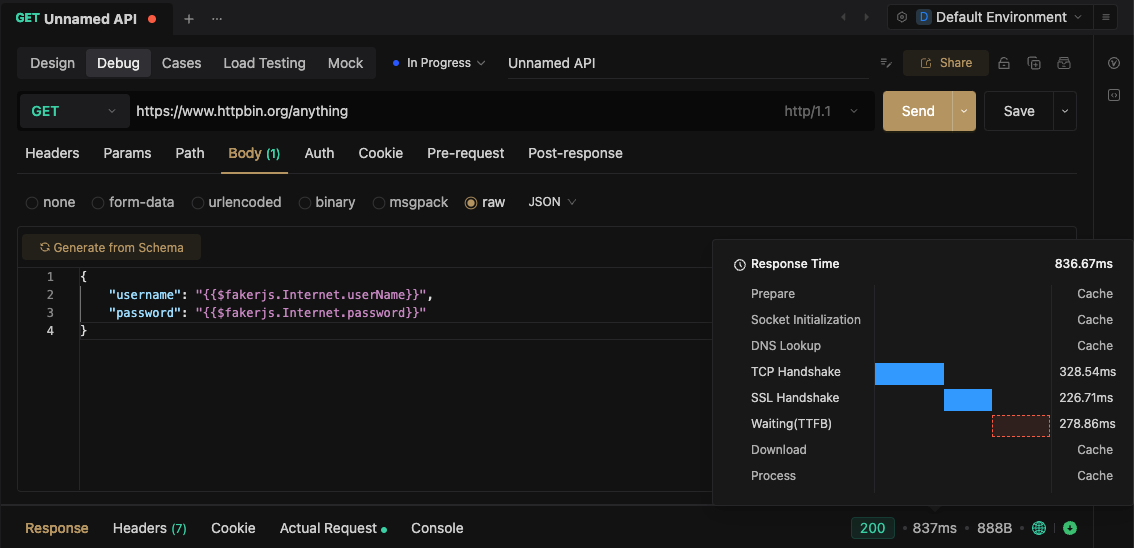
EchoAPI Response Time Metrics

1. Prepare — Request Preparation Time
Time spent constructing headers, validating parameters, and preparing the payload.
If it’s unusually long (>100ms), check for redundant frontend logic or unnecessary computations.
2. DNS Lookup — Domain Resolution Time
Time taken to resolve the domain (e.g., api.example.com) to an IP address.
Caching DNS results or using prefetching can reduce latency significantly.
3. TCP Handshake — Connection Establishment
The three-way handshake that opens a TCP connection.
High latency here can indicate network congestion or limited server capacity.
4. SSL Handshake — Secure Connection Setup
The time needed to negotiate encryption and verify certificates.
Switching to ECDSA certificates or optimizing certificate chains can shorten this stage.
5. TTFB (Time to First Byte)
Measures how long it takes for the first byte of the response to arrive.
A slow TTFB usually means backend processing delays — often due to inefficient database queries or complex business logic.
6. Download — Response Data Transfer
Time from receiving the first byte to the last.
If it’s long, the payload might be too large — remove redundant fields or enable gzip compression.
7. Process — Client-side Processing
Time the client spends parsing and rendering data.
Optimize rendering (e.g., use virtual lists) to reduce perceived lag.
Connecting the Dots: How to Analyze API Metrics Holistically
Looking at metrics in isolation tells only part of the story. Combining them helps pinpoint root causes.
Scenario 1: API Feels Slow
- Long DNS Lookup + TCP Handshake → Network or DNS issue.
- High TTFB → Server-side bottleneck.
- Long Download → Oversized response data.
Scenario 2: Security Warnings on the Client
- TLS Protocol < 1.2 → Upgrade immediately.
- Weak Cipher Suite → Use AES-GCM or SHA256+.
- Certificate CN mismatch → Check for phishing or misconfiguration.
Scenario 3: API Suddenly Fails
- Expired Certificate → Check
Valid Untiland renew. - Remote Address Changed → Possible DNS or load-balancer failure.
Conclusion
API request metrics form a comprehensive “health report” for your systems:
- Communication metrics ensure data goes to the right place.
- Security metrics ensure it’s transmitted safely.
- Performance metrics ensure it gets there fast.
By understanding and correlating these metrics, developers can prevent issues early, troubleshoot precisely, and optimize continuously.
Next time you analyze an API request, think in terms of Communication → Security → Performance — and you’ll uncover powerful opportunities for optimization.
After all, a stable, secure, and fast API is the foundation of any smooth-running business.


 EchoAPI for VS Code

 EchoAPI for IntelliJ IDEA

 EchoAPl-Interceptor

 EchoAPl CLI
 EchoAPI Client
 API Design
 API Debug
 API Documentation
 Mock Server


